Queries

Data for dashboard tiles comes from ‘Analysis’ (existing analysis in Kyubit Business Intelligence) or from MDX/TSQL queries.

This tutorial describes ‘Query’ creation and some important properties of queries. All queries available to current user are displayed in Dashboards -> Queries section of Kyubit Business Intelligence. Two query views are available: ‘All available Queries’ (considering query permissions) and all queries ‘Created by me’.

Dashboard software

Queries could be MDX queries for OLAP data source or SQL queries for SQL Server or ODBC Data sources that accept SQL query data requests.

All Kyubit Business Intelligence users could create query using Query design form and Data sources for which they are given permissions. ‘Query Type’ has two options:

  • Analytic data. This form of query consists of Categories and Series. First column defines Categories, while other columns presents Series and must contain numeric values. This form of query is used to present / visualize data on the dashboard.
  • Filter Values. This form of query is only used to list values that would be used as ‘drop down’ values for SQL filtering on the dashboard. Check section 8.2 ‘SQL Dashboard filtering’ for more details on this topic.
Dashboard software

For each query ‘Data source’ must be selected. If data source is OLAP database, MDX query will be expected and if data source is SQL database, TSQL query will be expected. Both MDX and TSQL queries always expect first column as category column with any type of data, while all subsequent columns are considered as series of values and must be of numeric type. Both MDX and TSQL queries expects at least one series of values (one category and one series columns of data).

For each of column of query data “Format string” definition could be defined to present data in appropriate manner to end users.

Dashboard software

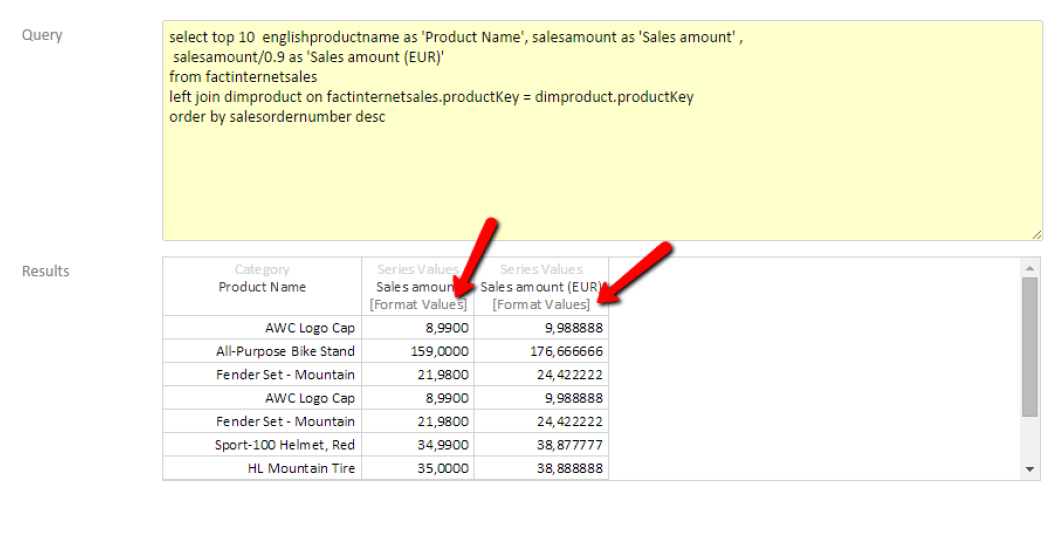
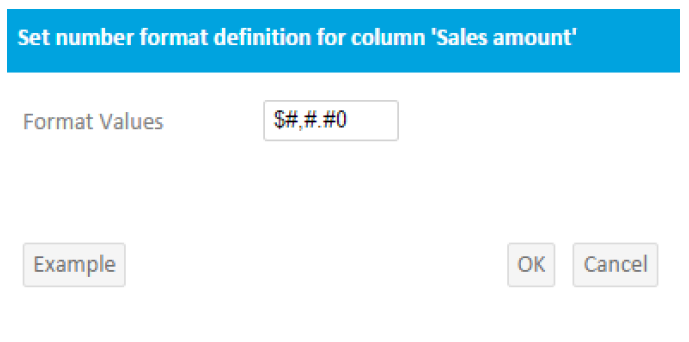
Click on the column ‘Format string’ option and fill-in measure format string for selected column.

Dashboard software queries

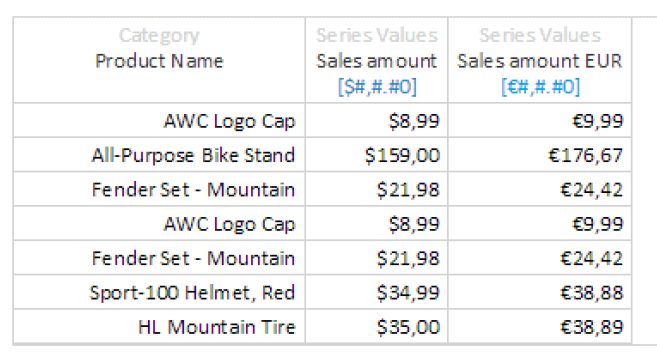
To get required number format output for data usage. Dashboard software queries


Examples of “Format string” for number 123456.789

$#,#.## => $123.456,78
€#,#.## => €123.456,78
#.## USD => 123456,78 USD
#,#.# => 123.456,7
#,#.### => 123.456,789
#,#.###0 => 123.456,7890
#,# => 123.456

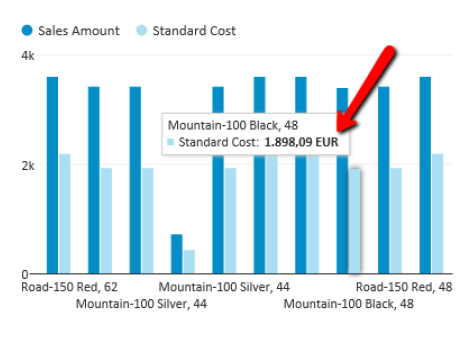
Same measure unit will be displayed wherever this query is used on any of the dashboard visual elements (tiles).

Dashboard software
By default, query will be executed in the context of current user. If for any reason data source needs to be accessed with different user credentials. Impersonate user credentials could be defined on ‘Impersonate’ tab on the query design form.

Dashboard software
Query results could be cached to avoid production data sources from constant query execution and save their processing time. Imagine hundreds of users opening same dashboard and for each opening queries to underlying data sources executes each time dashboard is opened. That kind of query execution is unnecessary in most scenarios and caching queries for certain amount of time perfectly good for most dashboard scenarios. To set caching on certain query, open query design form and on ‘Caching’ tab set number of minutes for which query results will be cached. Query results are cached on two levels. First, query results are cached on ASP.NET level within Kyubit Business Intelligence application memory. If, for any reason, IIS is restarted or application is recycled within IIS execution, query results are stored in Kyubit Business Intelligence internal database. In both cases, cached query results will expired after defined amount of time and original data source will be queries afterwards.