Grid Analytics
To start with self-service analytics, click on the 'Start Analysis' on the Kyubit Business Intelligence page.
By default, 'Grid Analysis' view will be opened as default analysis view, which could be changed to 'Chart Analysis' view at any time.
If you have only one cube reference, Grid Analysis screen will immediately become visible and
ready for analysis. If there are more cube references, user will be asked for which OLAP cube to start the analysis.
If required OLAP cube is not on the data source list, select 'New OLAP Data Source' and create new OLAP cube reference.

Most common way of OLAP data analysis in Kyubit Business Intelligence application is 'Grid Analysis'.
Drag-and-drop measures, hierarchies/levels from OLAP cube tree structure to grid areas on the right side to
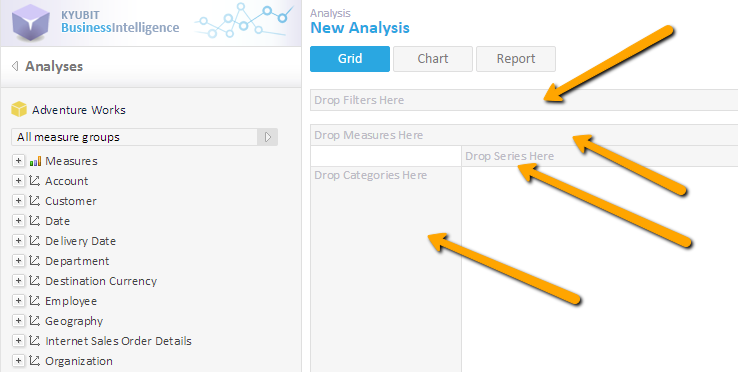
analyze OLAP data. Following areas exist for grid analysis:
- Cube structure Tree
- Categories area(Axis)
- Series area (Axis)
- Measures area
- Filters area
- Values area

Drag-and-drop OLAP Cube Tree Structure elements to Grid Area
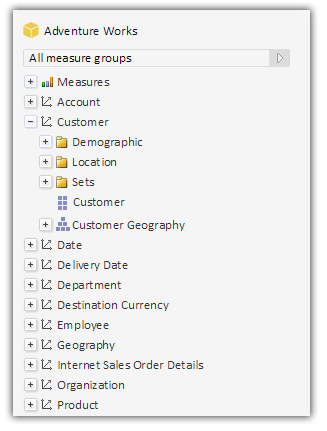
Every OLAP cube consists of measures, dimensions and hierarchies. Cube structure is defined in OLAP database and
within Kyubit Business Intelligence is displayed using tree view. Analysis is performed by drag-and-drop of OLAP structure elements.
(Measures, dimension hierarchies) to appropriate areas on the right to grid analysis area.

Categories and series
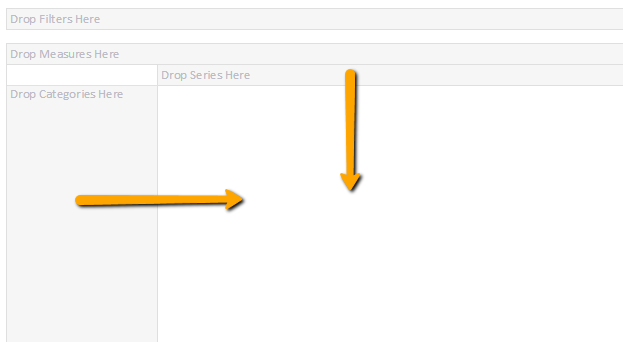
To see some measure over some entity structure (dimension), drag OLAP dimension hierarchies from the OLAP tree structure,
visualized with the tree view on the left side of the screen, to the Categories and/or Series area.
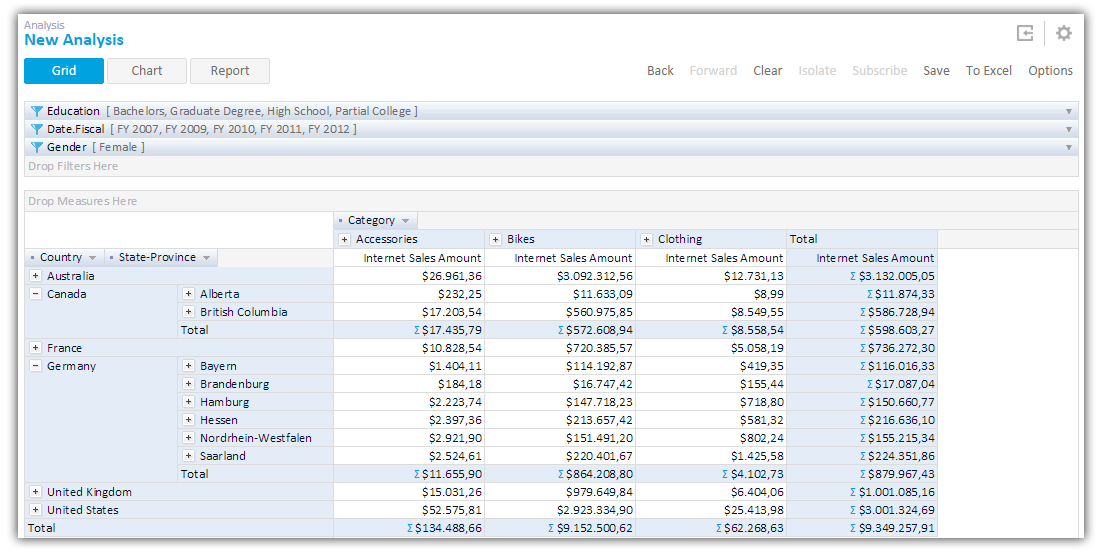
For example, Countries dimension hierarchy could be placed on Category axis and Product dimension hierarchy on the
Series axis. Corresponding values from OLAP cube will appear on the values area in the center of the screen.
To remove dimension hierarchy from analysis, drag dimension hierarchy from Categories or Series area to cube tree or
select dimension hierarchy (one click) and press Delete key.
