End-user Dashboard Actions
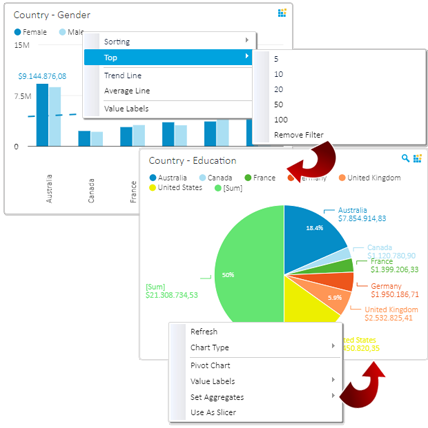
At any time using the Dashboard, end-user can choose set of actions to additionally explore data on the chart. Some of actions available to end-user are:
sorting of the
data, selecting
TOP x values,
PIVOT chart data, change display of
value labels overall or for specific series, display
SUM and
Average value, display
Trend or
Average line.
All actions applied on the dashboard are also rendered within Dashboard export to PDF file.

Use Chart as Dashboard Slicer
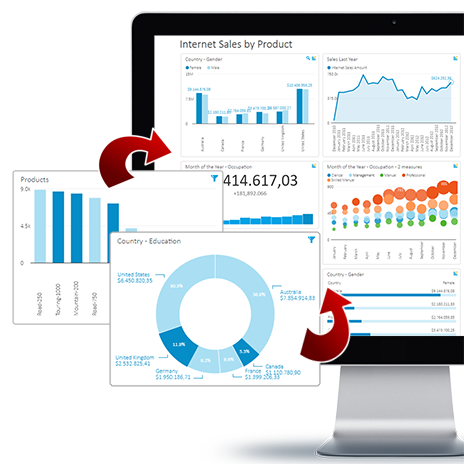
End-user on the dashboard can select chart to behave as slicer for other visualizations on the dashboard that are based on the same OLAP data source.
Column chart, Line chart, Pie chart, Doughnut chart and TreeMap chart can be turned to slicer mode at any time to explore and analyze dashboard data by simply clicking on the chart segments.
At the same time, more than one chart could be in slicer mode to filter whole dashboard in many combinations.
