Analytics in multiple decomposition steps...
Decomposition analytics consists of analysis levels (steps) added with the option to select level members that we would like to explore in
subsequent levels we are about to add to see details of analysis interest. This is data drill-down in multiple steps, with a great possibility
to change selected members of any level, at any time. After you click any level member, it will be included in the level selection, and the complete
decomposition tree will be recalculated and visualized with the new selection. Decomposition analysis can be saved and shared with other authorized users, collaborate by adding comments
and the decomposition leaf (last) level can be used to visualize data on the dashboards. Saved decomposition analysis are displayed in the 'Analysis' section of the application with its characteristic
icon.
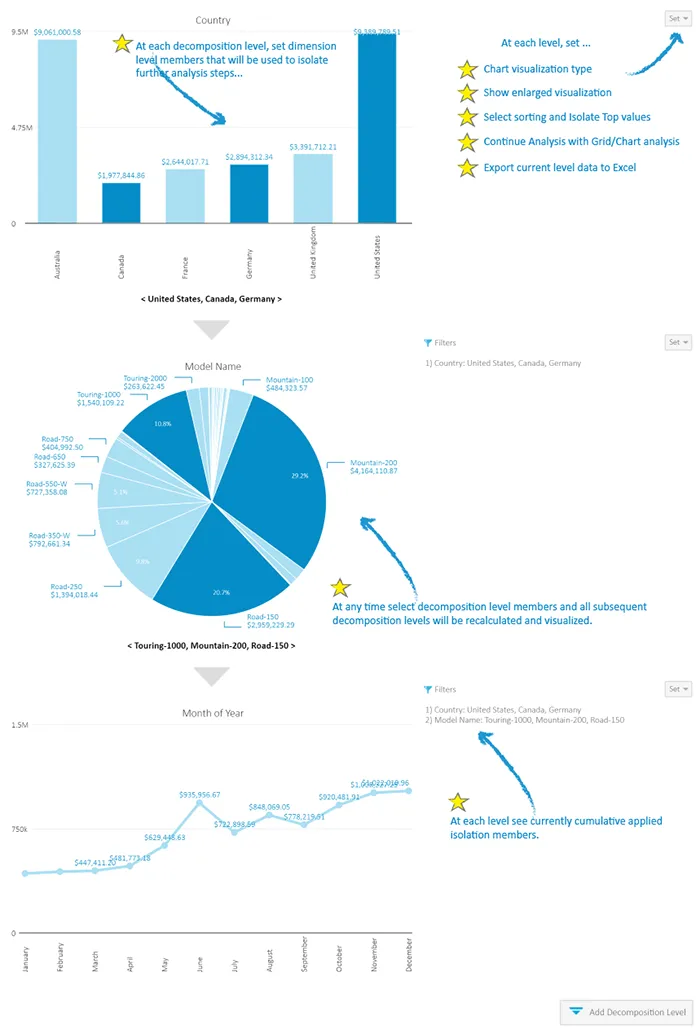
Decomposition options
At each decomposition level, the user can select the visualization type that best fits current data and the nature of analysis (Column Chart, Line Chart, Pie Chart, Doughnut Chart, Table Chart).
Level members can be sorted and members can be isolated by TOP n items to narrow level members display of dimensions hierarchies with lots of members.
Each Level can be opened in an enlarged view with options to visualize and explore the decomposition level using the whole screen,
export decomposition level data in an Excel file (with or without chart visualization) or perform Drill-Through actions built in OLAP cube or created ad-hoc in Kyubit Business Intelligence
application.
If appropriate at a certain point, continue particular decomposition level analysis with standard Grid/Chart analysis in a separate window tab.
All decomposition levels can be isolated with additional filters that are added on the top of the analysis and are applied to all visible data on the decomposition tree.